Introduction to PySpark Histogram
PySpark Histogram is a way in PySpark to represent the data frames into numerical data by binding the data with possible aggregation functions. It is a visualization technique that is used to visualize the distribution of variable . PySpark histogram are easy to use and the visualization is quite clear with data points over needed one.
This visualization of data with histogram helps to compare data with data frames and analyze the report at once based on that data. Bar charting can be used to create the visualization pattern with the spark data frame and by plotting them gives us clear picture about the data and its information about the data. So by having PySpark histogram we can find out a way to work and analyze the data frames, RDD in PySpark.
Syntax of PySpark Histogram
The syntax for PySpark Histogram function is:
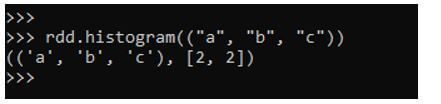
rdd.histogram(("a", "b", "c"))Output:
Explanation:
- rdd: The PySpark RDD.
- histogram: The visualization function.
Working of PySpark Histogram
Let us see how the Histogram works in PySpark:
1. Histogram is a computation of an RDD in PySpark using the buckets provided. The buckets here refer to the range to which we need to compute the histogram value.
2. The buckets are generally all open to the right except the last one which is closed.
3. For Example any RDD for which we need to compute RDD will create a bucket for which the right opens are opened except the last one.
4. [11,20,34,67] will represent the bucket as [11,20) opened , [20,34) opened ,[34,67] as closed.
5. The open bucket means the data cannot be equal to that, it will be always less than the open value.
That means that the value for the above bucket will lie somewhere like:
- 11 <=y<20 ;
- 20<=y<34;
- 34<=y<=67
6. There should be sorted buckets and doesn’t contain any duplicate values.
7. The bucket must be at least 1. If the buckets are number that is evenly spaced then the resulting value will also be spread evenly in a histogram.
8. If an RDD range is infinity then NAN is returned as the result.
9. If we will try to see the definition of histogram it is somewhat stated in documentation as:
Method Definition:
def histogram(bucketount: Int): (Array[Double], Array[Long])
10. It is used to compute the histogram of the data using the bucket count of the buckets that are between the maximum and minimum of the RDD in a PySpark.
11. We can also define the buckets of our own.
Examples of PySpark Histogram
Let us see some examples of how to compute Histogram.
Example #1
Let’s create a PySpark RDD.
Code:
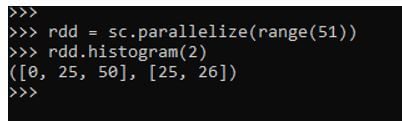
rdd = sc.parallelize(["ab", "ac", "b", "bd", "ef"])
rdd = sc.parallelize(range(51))
Lets plot the histogram for the made RDD.
rdd.histogram(2)
This will create a histogram with bucket 2. The result will create the histogram.
Output:
Example #2
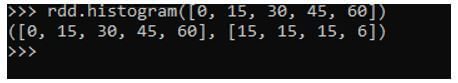
Let’s try to create a PySpark RDD and try to compute Histogram with evenly space buckets.
Code:
rdd.histogram([0, 15, 30, 45, 60])This will create an RDD with evenly spaced buckets.
Output:
Example #3
Let’s try to plot a histogram with an RDD as a String Data Type.
Code:
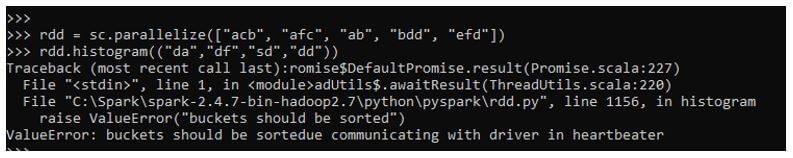
rdd = sc.parallelize(["acb", "afc", "ab", "bdd", "efd"])This will create an RDD with type as String.
rdd.histogram(("a", "b", "c"))Create a Histogram with the RDD. This will compute the histogram for the given RDD.
(('a', 'b', 'c'), [3, 1])It’s necessary to be the bucket as the sorted on. An unsorted bucket will give an Error while Plotting a Histogram.
Example #4
Let’s try to pass an unsorted bucket and plot the histogram.
While creating a Histogram with an unsorted bucket we get the following error:
ValueError: buckets should be sorted communicating with driver in a heartbeat
rdd.histogram((“da”,”df”,”sd”,”dd”))
Here we are trying to create a bucket that is an unsorted one. While plotting the histogram we get the error to sort the buckets while communicating with the driver.
Output:
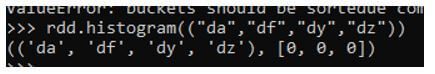
The same can be created successfully if we just pass a sorted bucket over the RDD.
Code:
rdd.histogram(("da","df","dy","dz"))The same will plot the histogram for the given RDD.
Output:
We can also plot the data from the histogram using the Python library which can be imported and is used to compute and visualize the Data needed.
Statistical charts for analytics and data visualization can be plotted with the Data Frames in PySpark.