In this article, we will see Basic But Useful Functions for PySpark DataFrame. Let’s get started.
PySpark
Pyspark DataFrame
In this article, we’ll discuss 10 functions of PySpark that are most useful and essential to perform efficient data analysis of structured data.
#installing pyspark
!pip install pyspark
#importing pyspark
import pyspark
#importing sparksessio
from pyspark.sql import SparkSession
#creating a sparksession object and providing appName
spark=SparkSession.builder.appName("pysparkdf").getOrCreate()This SparkSession object will interact with the functions and methods of Spark SQL. Now, let’s create a Spark DataFrame by reading a CSV file. We will be using simple dataset i.e. Nutrition Data on 80 Cereal products available on Kaggle.
#creating a dataframe using spark object by reading csv file
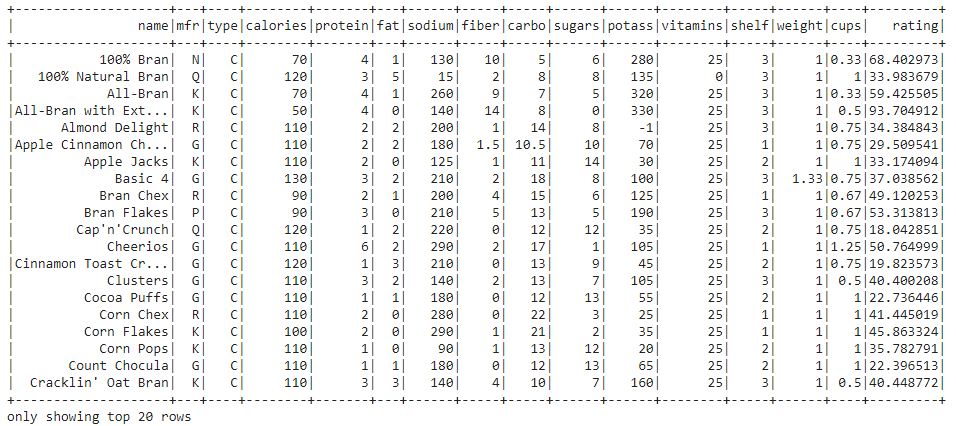
df = spark.read.option("header", "true").csv("/content/cereal.csv")
#show df created top 10 rows
df.show(10)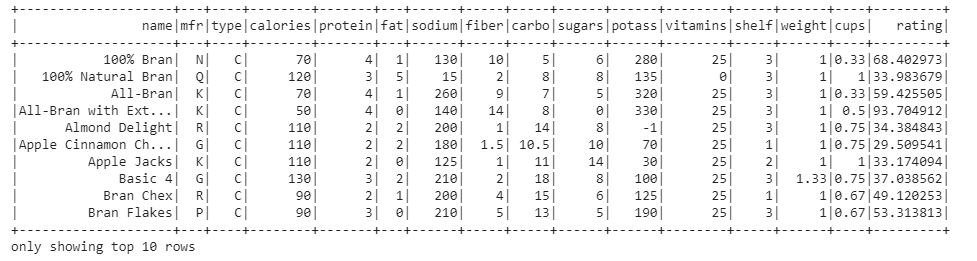
This is the Dataframe we are using for Data analysis. Now, let’s print the schema of the DataFrame to know more about the dataset.
df.printSchema()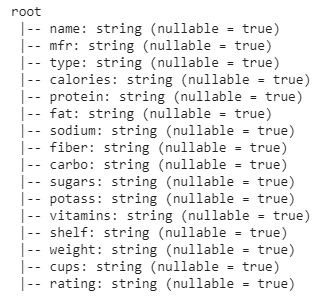
The DataFrame consists of 16 features or columns. Each column contains string-type values.
Let’s get started with the functions:
- select(): The select function helps us to display a subset of selected columns from the entire dataframe we just need to pass the desired column names. Let’s print any three columns of the dataframe using select().
df.select('name', 'mfr', 'rating').show(10)
In the output, we got the subset of the dataframe with three columns name, mfr, rating.
- withColumn(): The withColumn function is used to manipulate a column or to create a new column with the existing column. It is a transformation function, we can also change the datatype of any existing column.
In the DataFrame schema, we saw that all the columns are of string type. Let’s change the data type of calorie column to an integer.
df.withColumn("Calories",df['calories'].cast("Integer")).printSchema()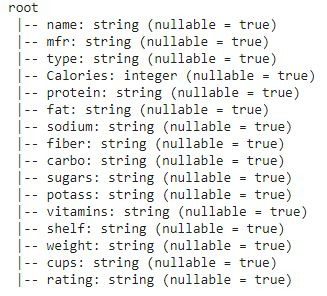
In the schema, we can see that the Datatype of calories column is changed to the integer type.
- groupBy(): The groupBy function is used to collect the data into groups on DataFrame and allows us to perform aggregate functions on the grouped data. This is a very common data analysis operation similar to groupBy clause in SQL.
Let’s find out the count of each cereal present in the dataset.
df.groupBy("name", "calories").count().show()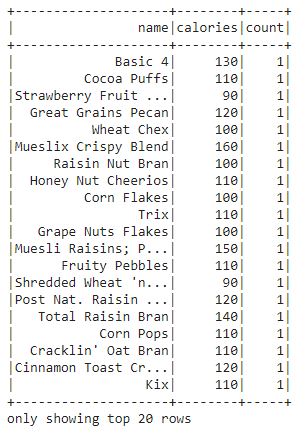
- orderBy(): The orderBy function is used to sort the entire dataframe based on the particular column of the dataframe. It sorts the rows of the dataframe according to column values. By default, it sorts in ascending order.
Let’s sot the dataframe based on the protein column of the dataset.
df.orderBy("protein").show()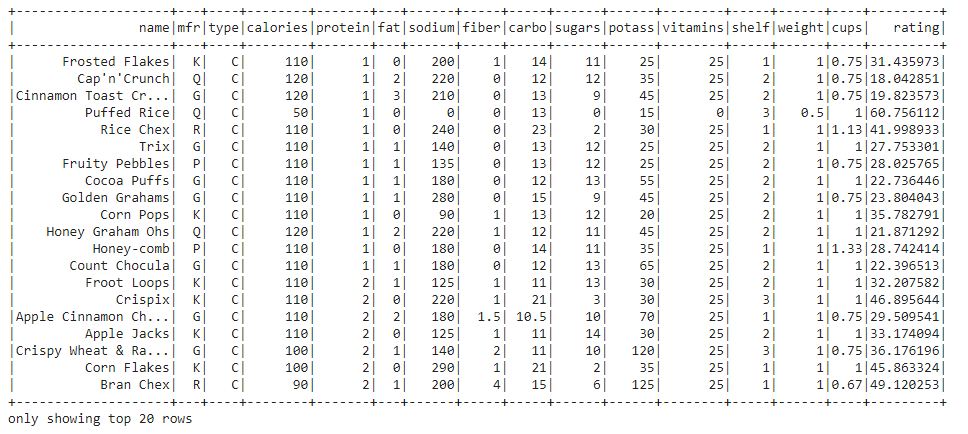
We can see that the entire dataframe is sorted based on the protein column.
- split(): The split() is used to split a string column of the dataframe into multiple columns. This function is applied to the dataframe with the help of withColumn() and select().
The name column of the dataframe contains values in two string words. Let’s split the name column into two columns from space between two strings.
from pyspark.sql.functions import split
df1 = df.withColumn('Name1', split(df['name'], " ").getItem(0))
        .withColumn('Name2', split(df['name'], " ").getItem(1))
df1.select("name", "Name1", "Name2").show()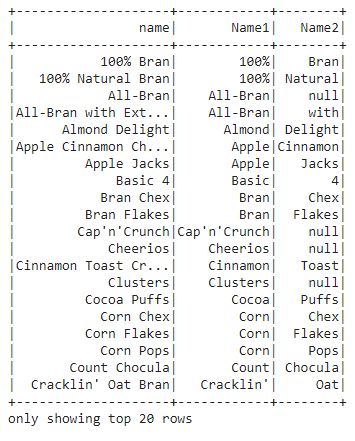
In this output, we can see that the name column is split into columns.
- lit(): The lit function is used to add a new column to the dataframe that contains literals or some constant value.
Let’s add a column “intake quantity” which contains a constant value for each of the cereals along with the respective cereal name.
from pyspark.sql.functions import lit
df2 = df.select(col("name"),lit("75 gm").alias("intake quantity"))
df2.show()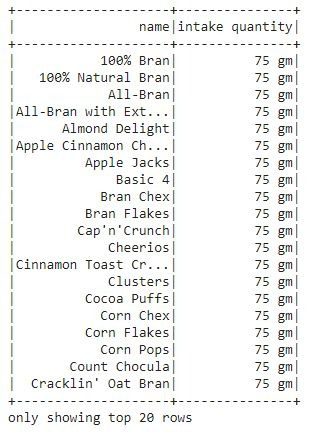
In the output, we can see that a new column is created “intak quantity” that contains the in-take a quantity of each cereal.
- when(): The when the function is used to display the output based on the particular condition. It evaluates the condition provided and then returns the values accordingly. It is a SQL function that supports PySpark to check multiple conditions in a sequence and return the value. This function similarly works as if-then-else and switch statements.
Let’s see the cereals that are rich in vitamins.
from pyspark.sql.functions import when
df.select("name", when(df.vitamins >= "25", "rich in vitamins")).show()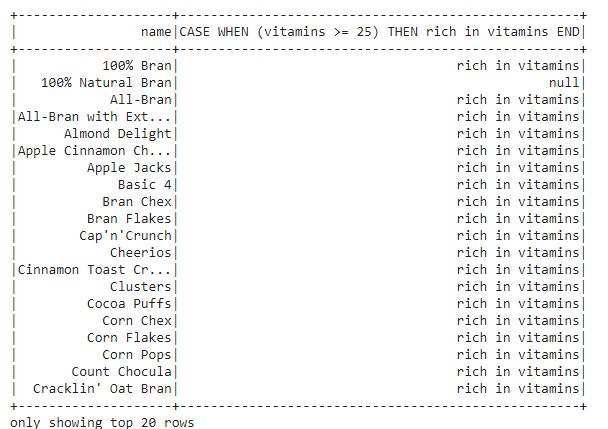
- filter(): The filter function is used to filter data in rows based on the particular column values. For example, we can filter the cereals which have calories equal to 100.
from pyspark.sql.functions import filter
df.filter(df.calories == "100").show()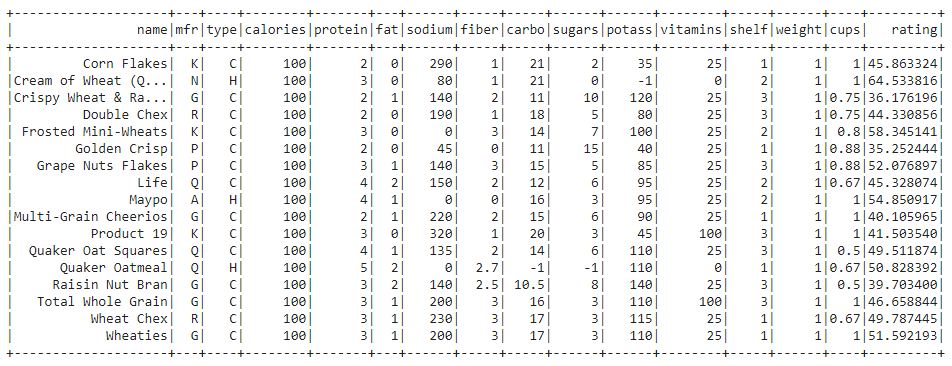
In this output, we can see that the data is filtered according to the cereals which have 100 calories.
- isNotNull(): These two functions are used to find out if there is any null value present in the DataFrame. It is the most essential function for data processing. It is the major tool used for data cleaning.
Let’s find out is there any null value present in the dataset.
#isNotNull()
from pyspark.sql.functions import *
#filter data by null values
df.filter(df.name.isNotNull()).show()
There are no null values present in this dataset. Hence, the entire dataframe is displayed.
- isNull():
df.filter(df.name.isNull()).show()
Again, there are no null values. Therefore, an empty dataframe is displayed.