The Linux operating system includes a plethora of tools, all of which are ready to help you administer your systems. From simple file and directory tools to very complex security commands, there’s not much you can’t do on Linux.
Determining memory usage is a skill you might need should a particular app go rogue and commandeer system memory. When that happens, it’s handy to know you have a variety of tools available to help you troubleshoot. Or, maybe you need to gather information about a Linux swap partition or detailed information about your installed RAM? There are commands for that as well. Let’s dig into the various Linux command-line tools to help you check into system memory usage. These tools aren’t terribly hard to use, and in this article, I’ll show you five different ways to approach the problem.
Below commands are demonstrated on the Ubuntu Server 18.04 platform. You should, however, find all of these commands available on your distribution of choice.
top
I want to start out with the most obvious tool. The top command provides a dynamic, real-time view of a running system. Included in that system summary is the ability to check memory usage on a per-process basis. That’s very important, as you could easily have multiple iterations of the same command consuming different amounts of memory. Although you won’t find this on a headless server, say you’ve opened Chrome and noticed your system slowing down. Issue the top command to see that Chrome has numerous processes running (one per tab – Figure 1).
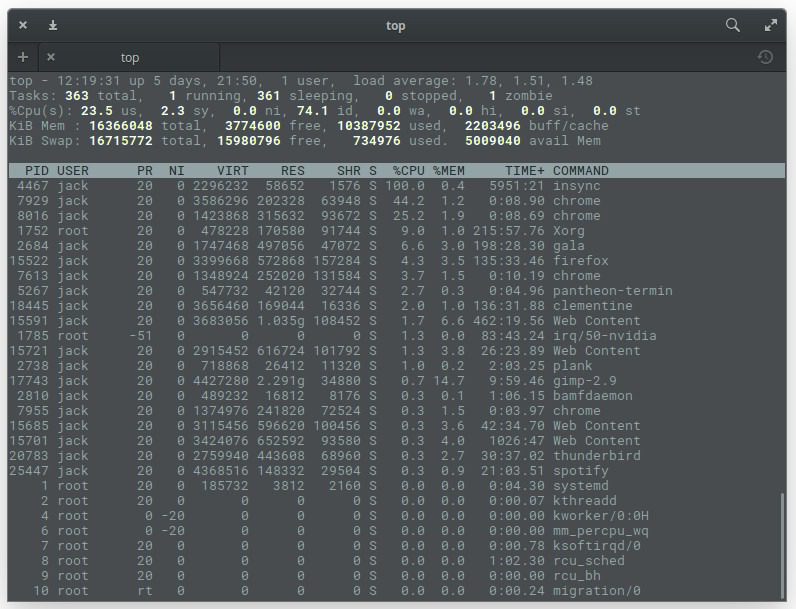
Chrome isn’t the only app to show multiple processes. You see the Firefox entry in Figure 1? That’s the primary process for Firefox, whereas the Web Content processes are the open tabs. At the top of the output, you’ll see the system statistics.a total of 16GB of RAM available, of which just over 10GB is in use. You can then comb through the list and see what percentage of memory each process is using.
One of the things top is very good for is discovering Process ID (PID) numbers of services that might have gotten out of hand. With those PIDs, you can then set about to troubleshoot (or kill) the offending tasks.
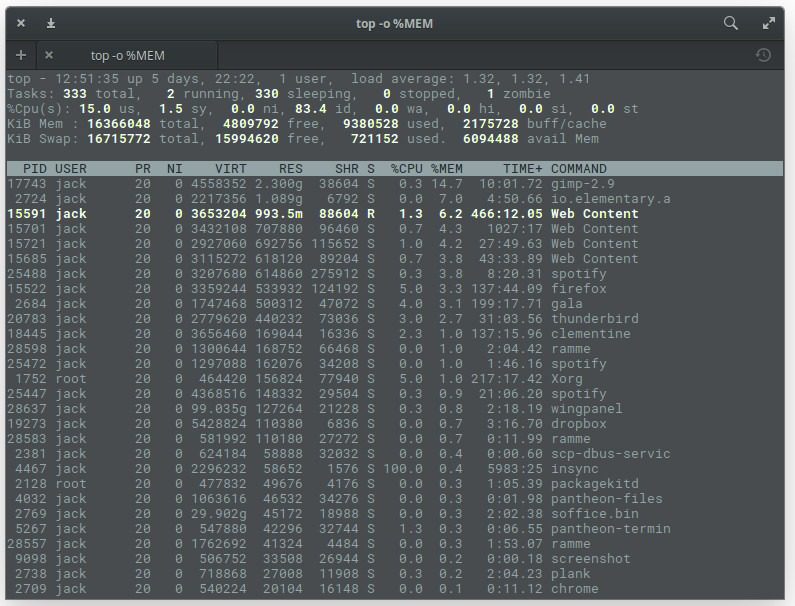
If you want to make top a bit more memory-friendly, issue the command top -o %MEM, which will cause top to sort all processes by memory used (Figure 2).
The top command also gives you a real-time update on how much of your swap space is being used.
free
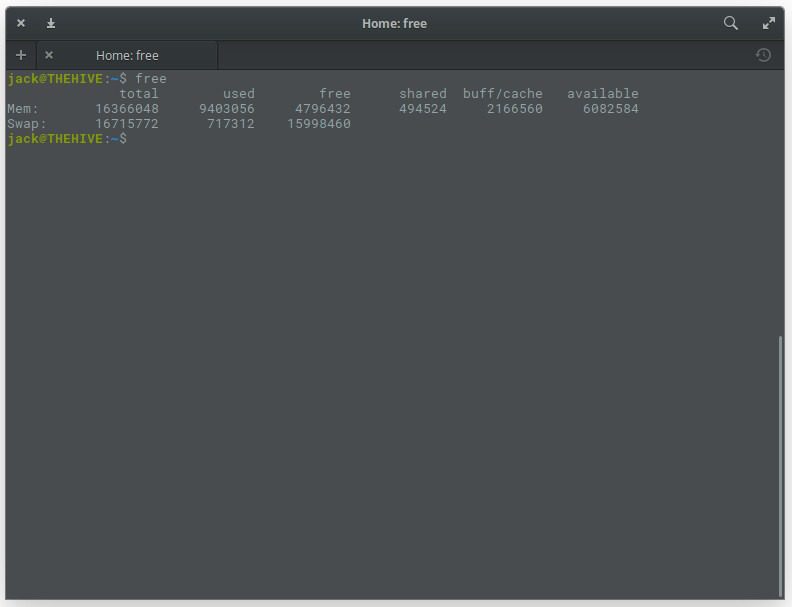
Sometimes, however, top can be a bit much for your needs. You may only need to see the amount of free and used memory on your system. For that, there is the free command. The free command displays:
- Total amount of free and used physical memory
- Total amount of swap memory in the system
- Buffers and caches used by the kernel
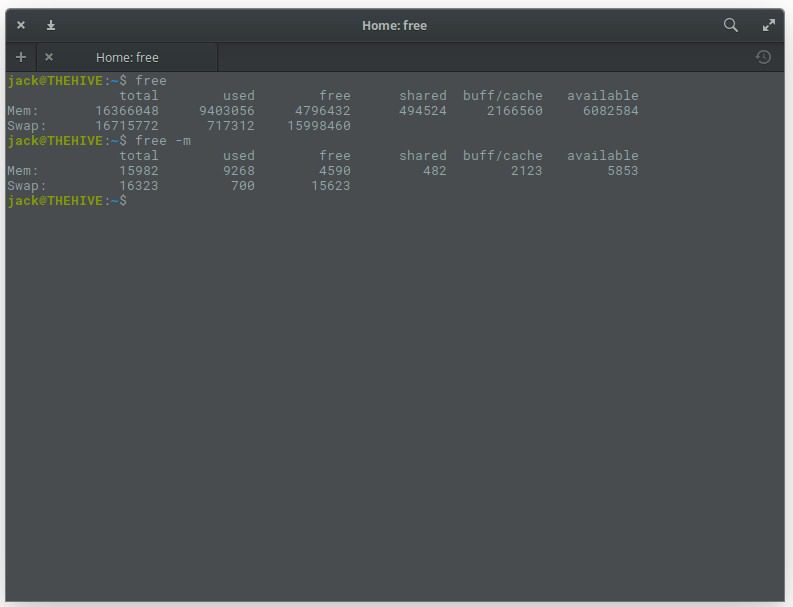
From your terminal window, issue the command free. The output of this command is not in real time. Instead, what you’ll get is an instant snapshot of the free and used memory in that moment (Figure 3).
You can, of course, make free a bit more user-friendly by adding the -m option, like so: free -m. This will report the memory usage in MB (Figure 4).
Of course, if your system is even remotely modern, you’ll want to use the -g option (gigabytes), as in free -g.
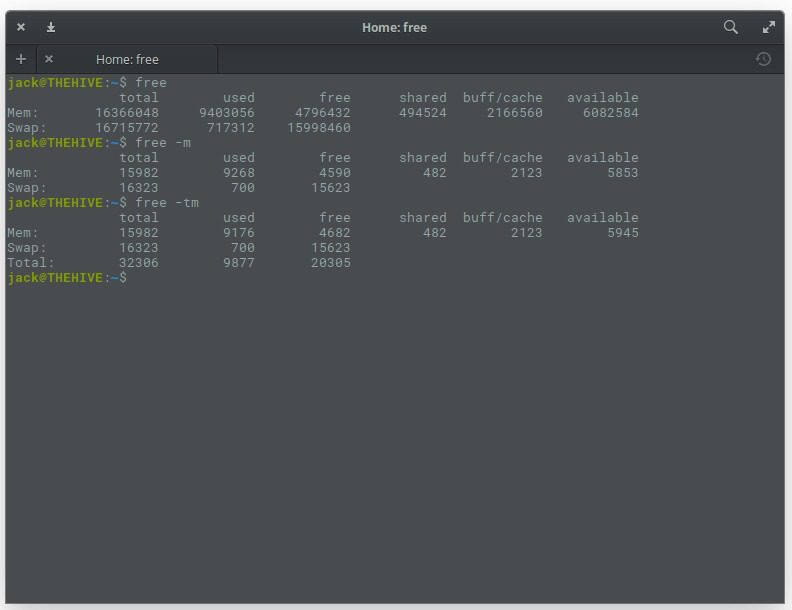
If you need memory totals, you can add the t option like so: free -mt. This will simply total the amount of memory in columns (Figure 5).
vmstat
Another very handy tool to have at your disposal is vmstat. This particular command is a one-trick pony that reports virtual memory statistics. The vmstat command will report stats on:
- Processes
- Memory
- Paging
- Block IO
- Traps
- Disks
- CPU
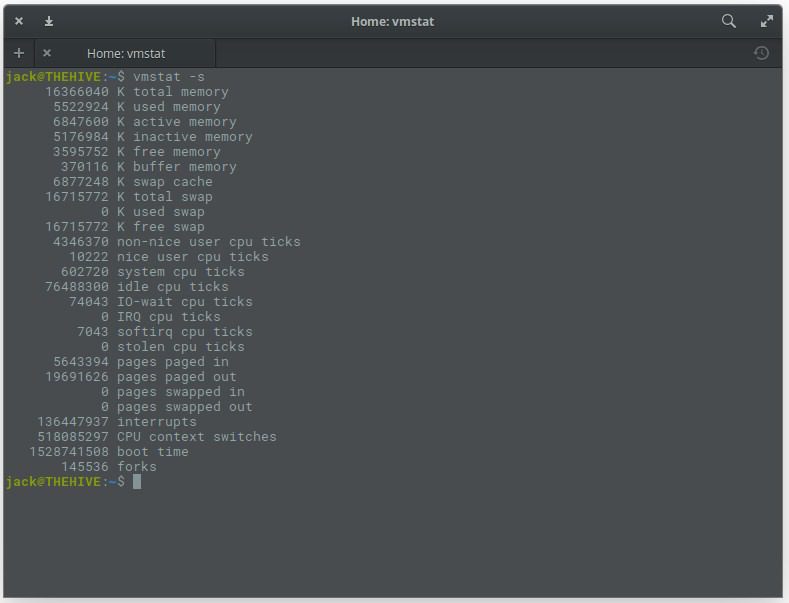
The best way to issue vmstat is by using the -s switch, like vmstat -s. This will report your stats in a single column (which is so much easier to read than the default report). The vmstat command will give you more information than you need (Figure 6), but more is always better (in such cases).
dmidecode
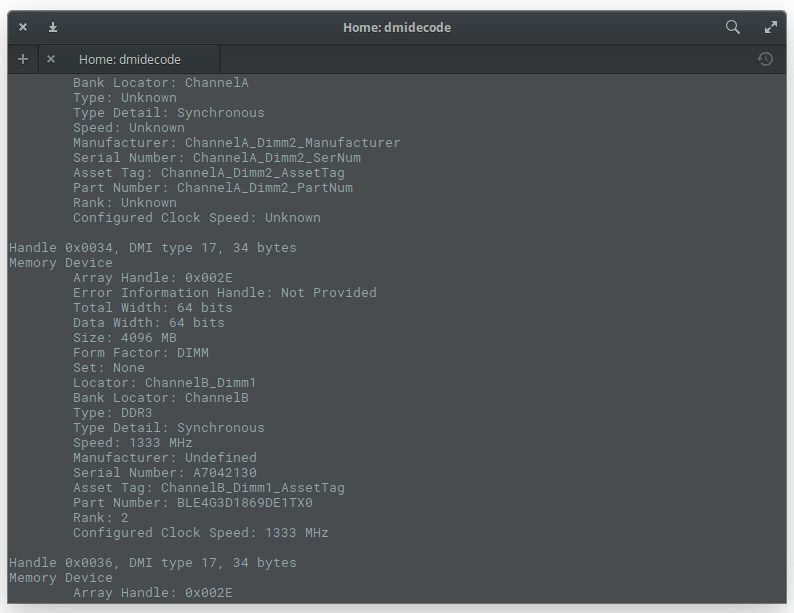
What if you want to find out detailed information about your installed system RAM? For that, you could use the dmidecode command. This particular tool is the DMI table decoder, which dumps a system’s DMI table contents into a human-readable format. If you’re unsure as to what the DMI table is, it’s a means to describe what a system is made of (as well as possible evolutions for a system).
To run the dmidecode command, you do need sudo privileges. So issue the command sudo dmidecode -t 17. The output of the command (Figure 7) can be lengthy, as it displays information for all memory-type devices. So if you don’t have the ability to scroll, you might want to send the output of that command to a file, like so: sudo dmidecode –t 17 > dmi_infoI, or pipe it to the less command, as in sudo dmidecode | less.
/proc/meminfo
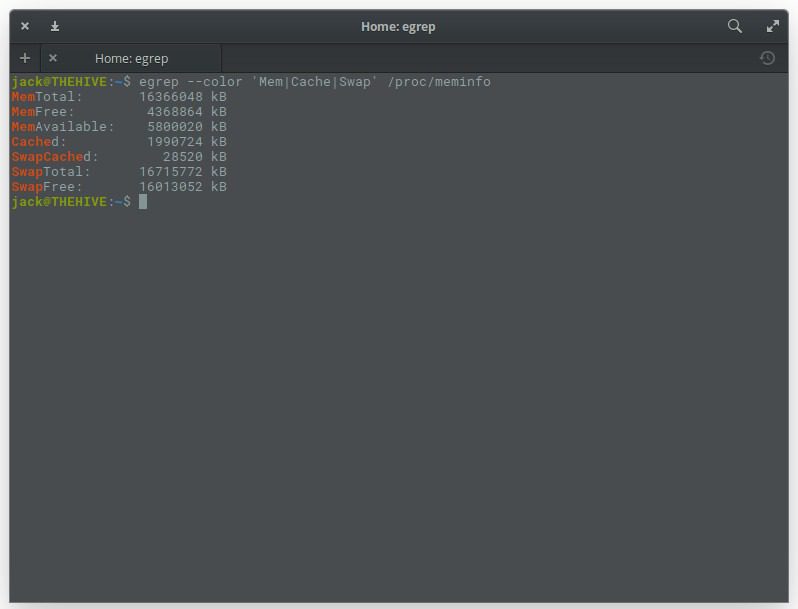
You might be asking yourself, “Where do these commands get this information from?”. In some cases, they get it from the /proc/meminfo file. Guess what? You can read that file directly with the command less /proc/meminfo. By using the less command, you can scroll up and down through that lengthy output to find exactly what you need (Figure 8).
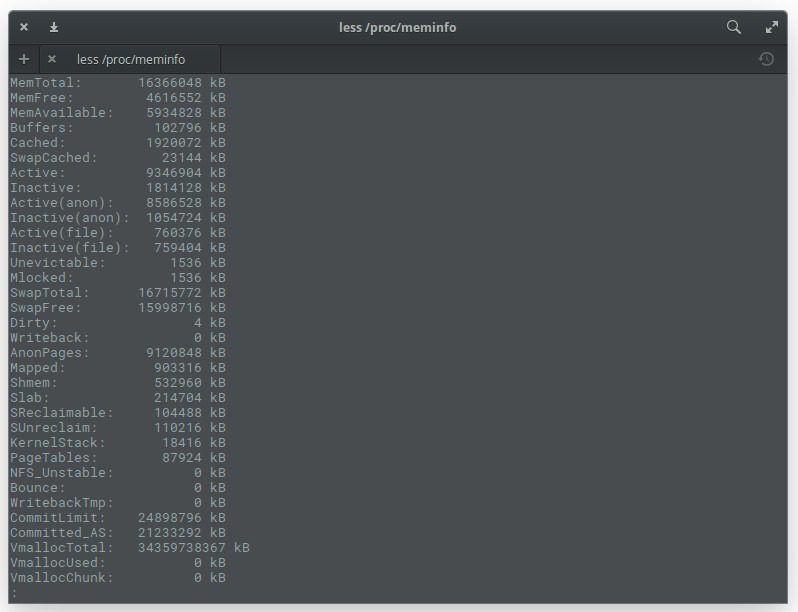
One thing you should know about /proc/meminfo: This is not a real file. Instead /pro/meminfo is a virtual file that contains real-time, dynamic information about the system. In particular, you’ll want to check the values for:
- MemTotal
- MemFree
- MemAvailable
- Buffers
- Cached
- SwapCached
- SwapTotal
- SwapFree
If you want to get fancy with /proc/meminfo you can use it in conjunction with the egrep command like so: egrep –color ‘Mem|Cache|Swap’ /proc/meminfo. This will produce an easy to read listing of all entries that contain Mem, Cache, and Swap … with a splash of color (Figure 9).